


JavaScript graphics are an essential aspect of modern web development. From dynamic data visualizations to engaging animations, JavaScript libraries and frameworks provide a wide range of tools to create visually appealing and interactive web applications. In this guide, we’ll delve into the world of JavaScript graphics, exploring the key libraries, techniques, and best practices to help you create stunning graphics for your web projects.
Why JavaScript Graphics?
JavaScript graphics are integral to enhancing user experience on the web. They enable developers to create interactive elements that can engage users, convey complex information through visual means, and provide a more immersive experience. With the rise of data-driven applications and interactive web content, mastering JavaScript graphics is more important than ever.
Key JavaScript Graphics Libraries
Several JavaScript libraries make it easy to create graphics on the web. Here are some of the most popular ones:
1. D3.js
D3.js (Data-Driven Documents) is a powerful library for creating dynamic and interactive data visualizations. It makes data come to life with HTML, SVG, and CSS. D3.js is highly flexible, allowing developers to bind arbitrary data to a Document Object Model (DOM), and then apply data-driven transformations to the document.
Features of D3.js
- Data Binding: D3.js allows you to bind data to DOM elements, making it easy to create complex visualizations that update automatically when the data changes.
- Scalable Vector Graphics (SVG): D3.js leverages SVG, which ensures that your graphics are resolution-independent and scalable.
- Customizable: D3.js offers extensive customization options, allowing you to create unique and tailored visualizations.
- Interactivity: D3.js provides tools for adding interactivity to your visualizations, such as tooltips, animations, and event listeners.
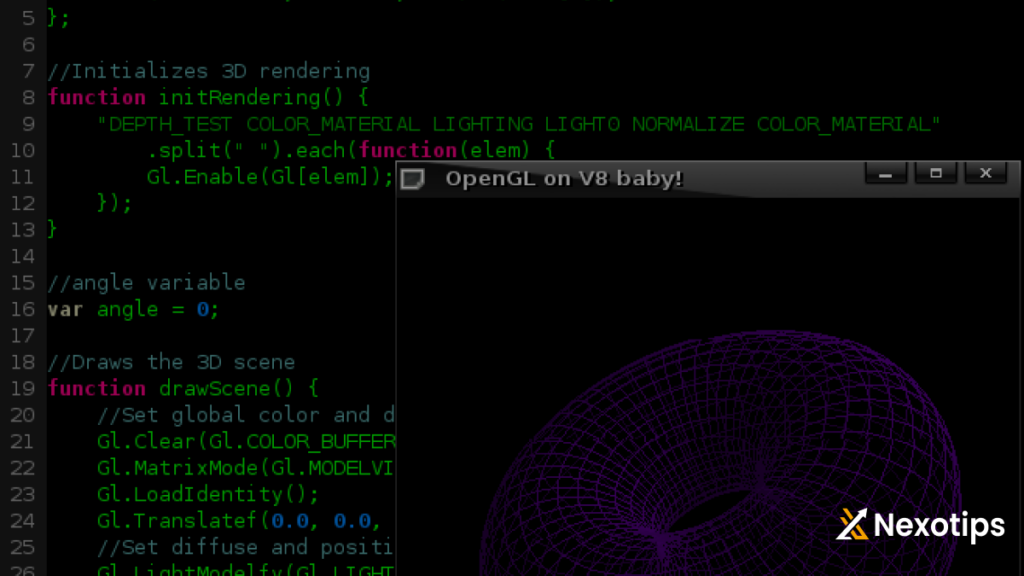
2. Three.js
A well-liked library for making 3D visuals in a browser is called three.js. It simplifies the process of creating complex 3D scenes, making it accessible even to developers who are not experts in 3D graphics. With Three.js, you can create stunning 3D visualizations, animations, and games.
Features of Three.js
- WebGL Support: Three.js uses WebGL to render high-performance 3D graphics in the browser.
- Scene Graph: Three.js provides a scene graph, which makes it easy to manage and manipulate 3D objects.
- Shaders: Three.js supports custom shaders, allowing you to create advanced visual effects.
- Extensive Documentation: Three.js has extensive documentation and a large community, making it easy to find tutorials, examples, and support.
3. p5.js
p5.js is a JavaScript library that makes creating graphics and interactive content simple and fun. It is based on the Processing language and is particularly popular in the creative coding community. p5.js is great for artists, designers, and beginners looking to get started with graphic programming.
Features of p5.js
- Simplicity: p5.js has a simple and intuitive API, making it easy to get started with creating graphics.
- Interactivity: p5.js provides tools for creating interactive content, such as mouse and keyboard events.
- Compatibility: p5.js is compatible with other JavaScript libraries, allowing you to integrate it into your existing projects.
- Community: p5.js has a vibrant community and a wealth of resources, including tutorials, examples, and forums.
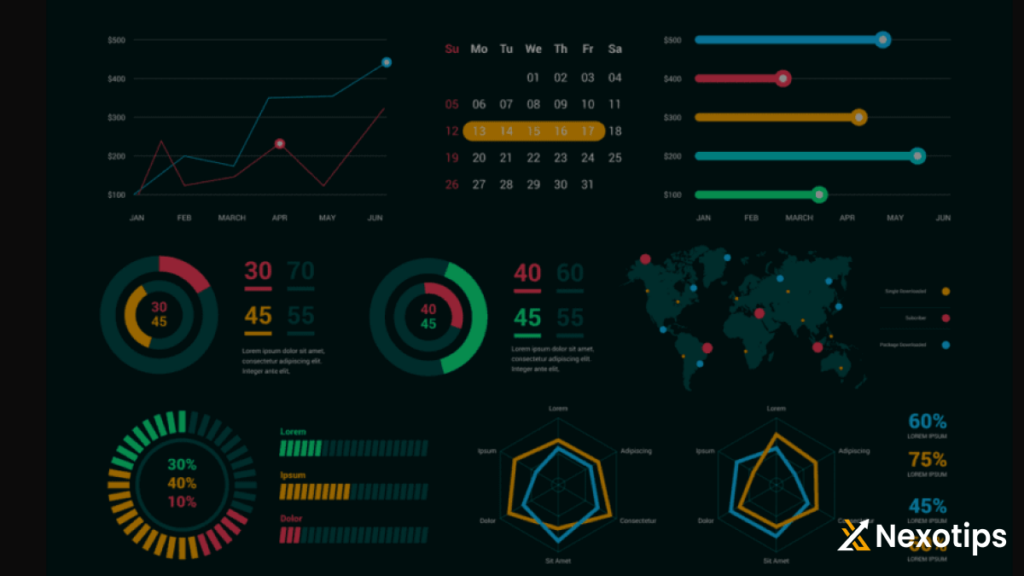
4. Chart.js
Chart.js is a straightforward library for creating responsive, customizable charts and graphs. It supports a variety of chart types, including bar, line, pie, and radar charts. Chart.js is perfect for developers who need to create data visualizations quickly and easily.
Features of Chart.js
- Easy to Use: Chart.js has a simple API, making it easy to create and customize charts.
- Responsive: Charts created with Chart.js are responsive by default, ensuring they look great on all devices.
- Animation: Chart.js supports animations, making your charts more engaging.
- Customization: Chart.js offers extensive customization options, allowing you to tailor the appearance of your charts to your needs.
Techniques for Creating JavaScript Graphics
Creating stunning JavaScript graphics involves understanding key techniques and best practices. Here are some essential tips:
1. Understanding the Canvas API
The HTML5 Canvas API is fundamental for creating graphics in JavaScript. It provides a way to draw shapes, text, images, and other objects on a web page. By mastering the Canvas API, you can create complex and interactive graphics from scratch.
Key Concepts of the Canvas API
- Drawing Shapes: The Canvas API provides methods for drawing basic shapes, such as rectangles, circles, and lines.
- Text Rendering: You can render text on the canvas using the
fillTextandstrokeTextmethods. - Image Manipulation: The Canvas API allows you to draw and manipulate images, such as cropping, scaling, and rotating.
- Path Drawing: The Canvas API supports path drawing, enabling you to create complex shapes and curves.
2. Leveraging SVG for Scalable Graphics
SVG (Scalable Vector Graphics) is an XML-based format for vector graphics. Unlike raster images, SVG graphics are resolution-independent, making them perfect for responsive designs. JavaScript can manipulate SVG elements, allowing for dynamic and interactive vector graphics.
Benefits of Using SVG
- Scalability: SVG graphics can be scaled to any size without losing quality, making them ideal for responsive designs.
- Accessibility: SVG elements can be styled and manipulated with CSS and JavaScript, allowing for rich interactivity.
- Performance: SVG files are typically smaller than equivalent raster images, leading to faster load times.
- Styling: SVG elements can be styled with CSS, allowing for consistent design across your web application.
3. Animations and Transitions
Adding animations and transitions can make your graphics more engaging. Libraries like GreenSock (GSAP) offer powerful tools for creating smooth animations. CSS animations and transitions can also be used in conjunction with JavaScript to enhance visual effects.
Techniques for Creating Animations
- CSS Animations: Use CSS keyframes and transitions to create simple animations directly in your stylesheets.
- JavaScript Animations: Use JavaScript to create more complex animations, such as moving elements along a path or creating physics-based interactions.
- GreenSock (GSAP): GSAP is a powerful JavaScript library for creating high-performance animations. It offers a simple API and a range of plugins for advanced effects.
4. Performance Optimization
Performance is crucial when dealing with graphics, especially for complex visualizations and animations. Techniques like requestAnimationFrame, off-screen rendering, and efficient event handling can significantly improve performance. Minimizing the use of heavy computations and optimizing code are also important for smooth graphics.
Tips for Optimizing Performance
- Use
requestAnimationFrame: This method ensures that your animations run at the optimal frame rate for the user’s device. - Reduce Repaints and Reflows: Minimize changes to the DOM and use techniques like off-screen rendering to avoid unnecessary repaints and reflows.
- Effective Event Management: To minimize the number of function calls, debounce or throttle event listeners.
- Code optimization: Make a profile of your code to identify high-performance regions and condense crucial sections.
Best Practices for JavaScript Graphics
To create effective and efficient JavaScript graphics, consider the following best practices:
1. Keep It Simple
While it can be tempting to create elaborate graphics, simplicity often leads to better performance and user experience. Concentrate on producing succinct, clear images that effectively communicate the intended idea without needless complication.
2. Optimize for Performance
Performance should be a priority when developing graphics. Use efficient algorithms, reduce unnecessary calculations, and leverage browser capabilities like hardware acceleration. Profiling and testing your graphics on different devices can help identify performance bottlenecks.
3. Ensure Accessibility
Accessibility is crucial for making your graphics usable by everyone. Use descriptive text for screen readers, ensure sufficient color contrast, and provide alternative text for non-text content. Accessible graphics benefit all users, including those with disabilities.
4. Remain Current
Web graphics is a field that is always changing, with new tools, frameworks, and techniques appearing on a regular basis. Stay informed about the latest developments, and continuously update your skills to leverage the most advanced and efficient solutions available.
Detailed Look at Key Libraries
D3.js: Data-Driven Documents
The ability to create powerful and flexible data-driven visualizations using D3.js is well known. It enables programmers to apply data-driven modifications to a document after binding any kind of data to a DOM. This library excels in creating complex and highly interactive visualizations.
Getting D3.js Started
You must incorporate D3.js into your project in order to begin using it. This may be accomplished by using a CDN to link to the D3.js library:
<script src="https://d3js.org/d3.v6.min.js"></script>Next, let’s create a simple bar chart:
<!DOCTYPE html>
<html lang="en">
<head>
    <meta charset="UTF-8">
    <title>D3.js Bar Chart</title>
    <script src="https://d3js.org/d3.v6.min.js"></script>
    <style>
        .bar {
            fill: steelblue;
        }
        .bar:hover {
            fill: orange;
        }
    </style>
</head>
<body>
    <script>
        // Data
        const data = [30, 86, 168, 281, 303, 365];

        // Set up the SVG canvas dimensions
        const width = 500;
        const height = 300;
        const barWidth = width / data.length;

        // Create the SVG element
        const
Others: Understanding JQuery: A Comprehensive Guide In 2024.